FlowSheet Data Workbench
Without script programming!
The graphical editor of the FlowSheet Data Workbench is the most advanced modelling tool for data flow graphs!
The simple and intuitive way of modelling with your data in real-time is supported by powerful functions of data inspection (even on several displays) and a context sensitive help system. Owing to parallel program execution you can model simultaneously while your data flow graph is being executed.
Collaboration in a team as well as seamless integration into the ANKHOR server world establishes the FlowSheet Data Workbench as the central tool for the greatest diversity of data projects.


Data Sources
ANKHOR FlowSheet supports a multitude of data sources and the processing of various kinds of data. An arbitrary number of data sources can be used at the same time. Next to the data of the data import you can also gather data and use it as a source. Numerous editing functions ease the handling of that constant data. ANKHOR FlowSheet does not restrict data to simple data types like numbers, strings or date values but processes even complex data types in a very simple manner.
![]() Files
Files
Wizard operators make it easy to import data from Microsoft Excel files, CSV and text files with a fixed column layout. Moreover, numerous other data formats are supported and can additionally be extended.
![]() Web
Web
ANKHOR FlowSheet allows for processing external data from the Internet via HTTP or FTP accesses. Web access is simplified by XML based function calls, e.g., through SOAP or RESTful APIs and data formats like JSON and MHTML.
![]() Database
Database
ANKHOR FlowSheet accesses databases with an ODBC connection and SQL queries. The database accesses can also be modelled inside the ANKHOR data flow paradigm (compiled SQL).
Data Processing
ANKHOR FlowSheet is deployed with a large library of operators, which cover a large spectrum of applications. Among others, are supported:
 Data Preprocessing
Data consolidation, ETL processing (Extract - Transform - Load) and data cleansing are also important basic functions in ANKHOR FlowSheet's data pre-processing libraries.
 Spreadsheet
ANKHOR FlowSheet picks up the approved principle of spreadsheet calculation and takes it to the next level, since it overcomes the known problems and restrictions of spreadsheets with a visual approach for data manipulation.
 OLAP Data Cubes
ANKHOR FlowSheet can generate multi-dimensional OLAP data cubes directly from tables in a highly optimized in-memory way, and it provides numerous intelligent operators for Drill and Slice-and-Dice Analysis as well as for data aggregation. Video
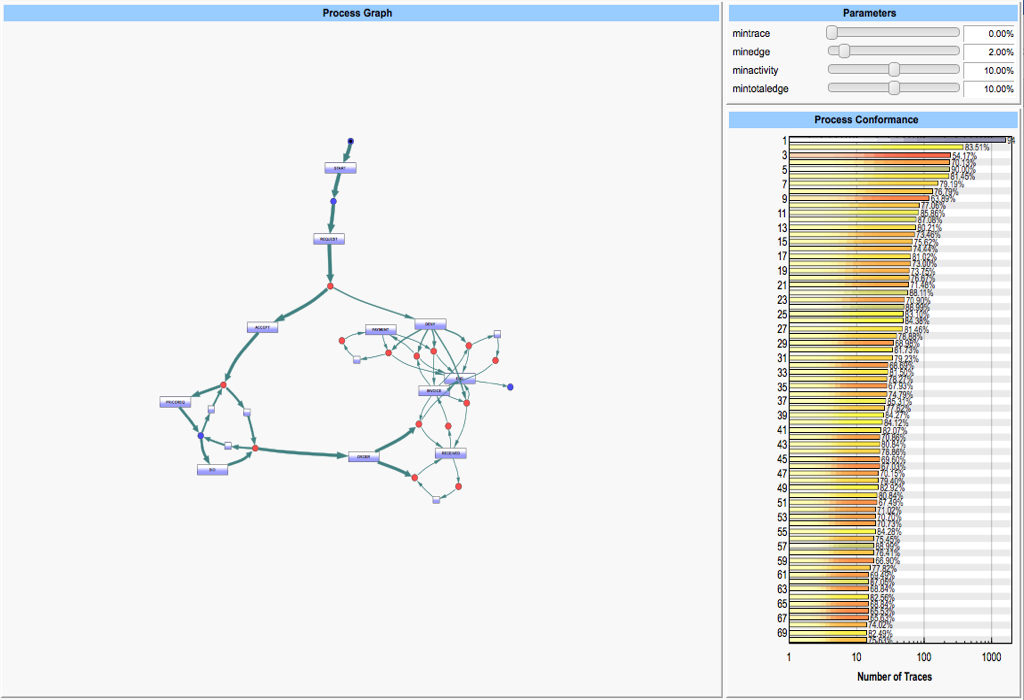
 Advanced Analytics
Data analyses are supported in ANKHOR FlowSheet with a multitude of analysis methods from the areas of data mining, statistics and prediction. Specific methods of analysis can be extended through the library system.
individual processing
ANKHOR FlowSheet can also be extended individually, owing to the integrated programming language. Model your own processing in the same graphical paradigm (without having to learn additional script programming). For this use the built-in operator primitives, the combination with operators from the libraries or adapt your already existing operators to your own requirements. Integrating external data processing such as in R or Python is also supported.
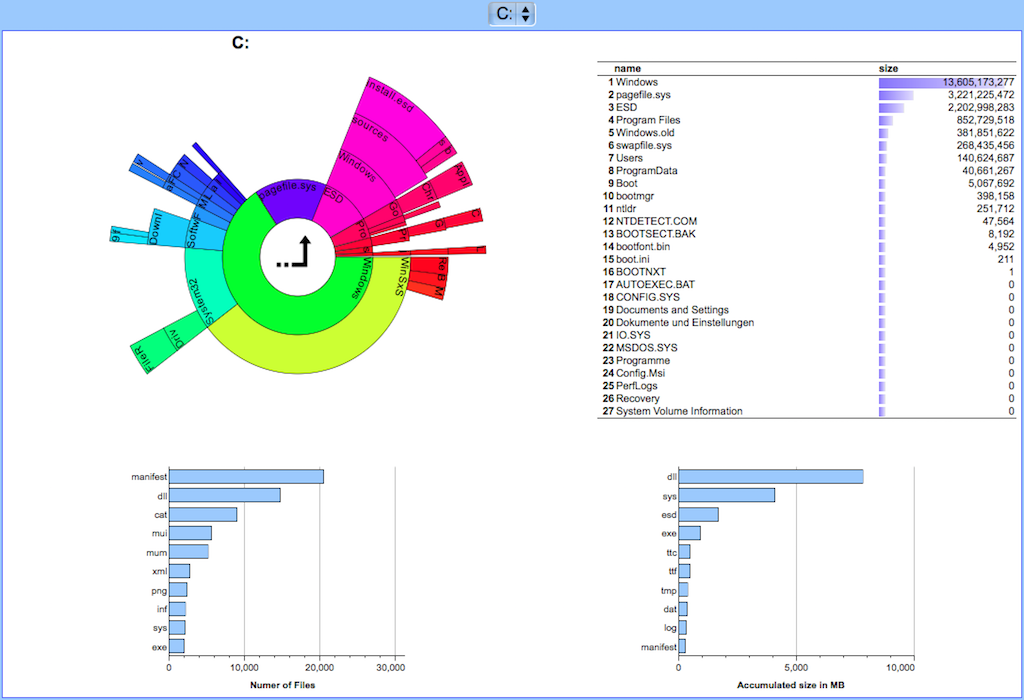
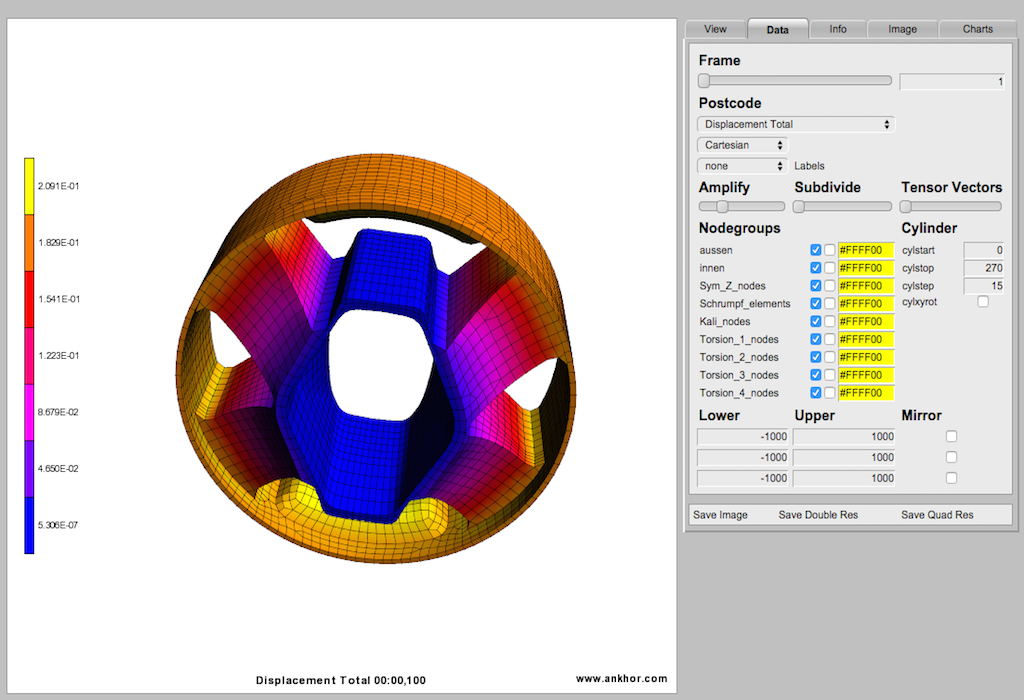
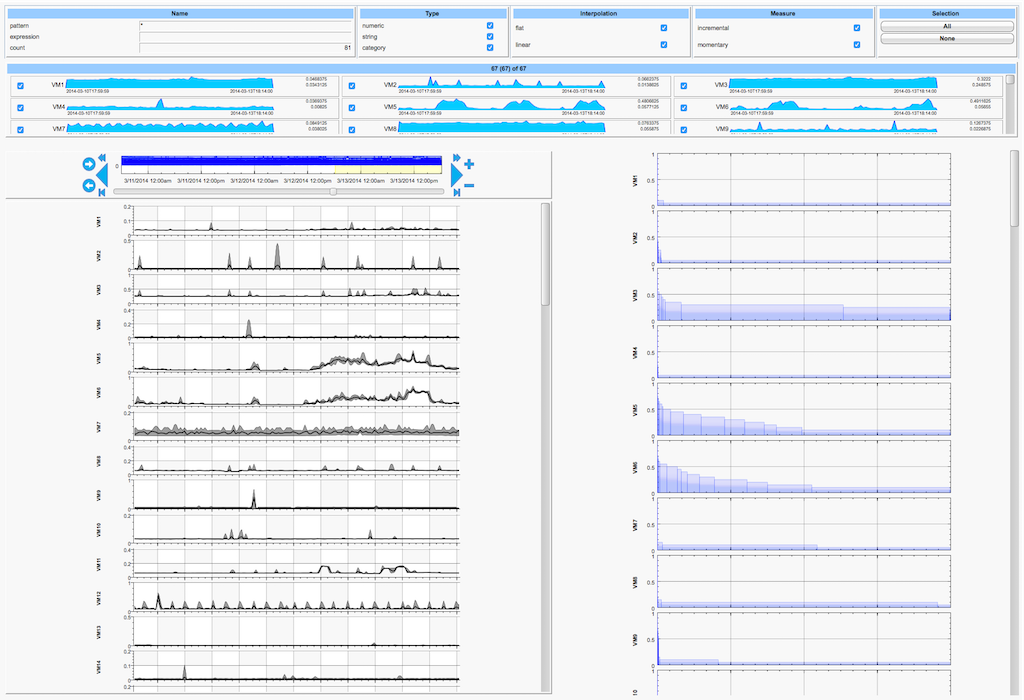
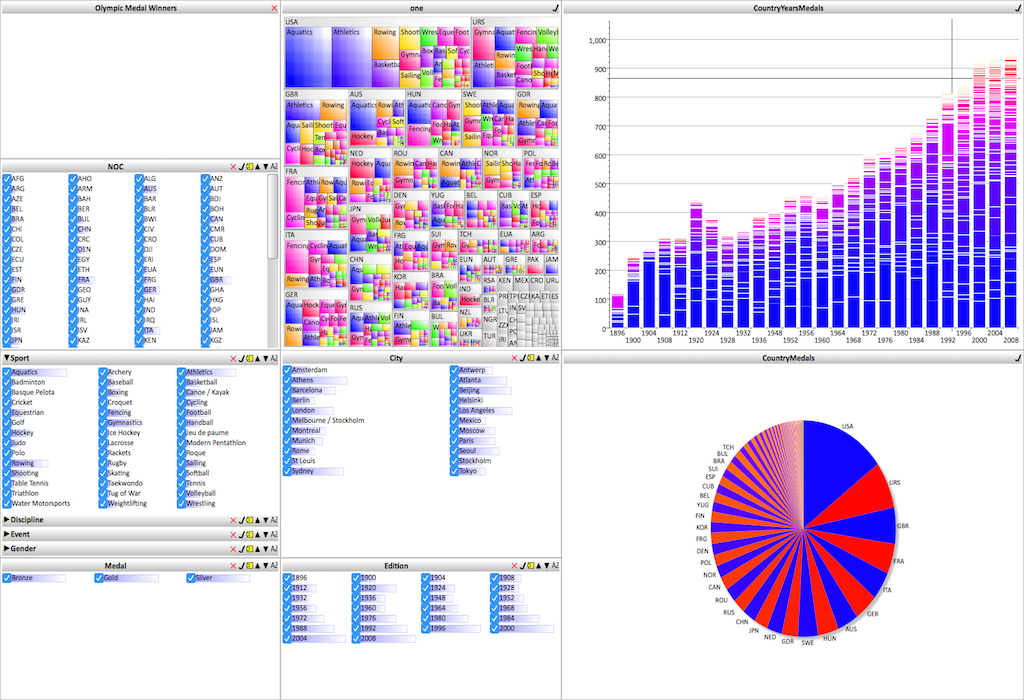
Charts, Graphs and Visualizations
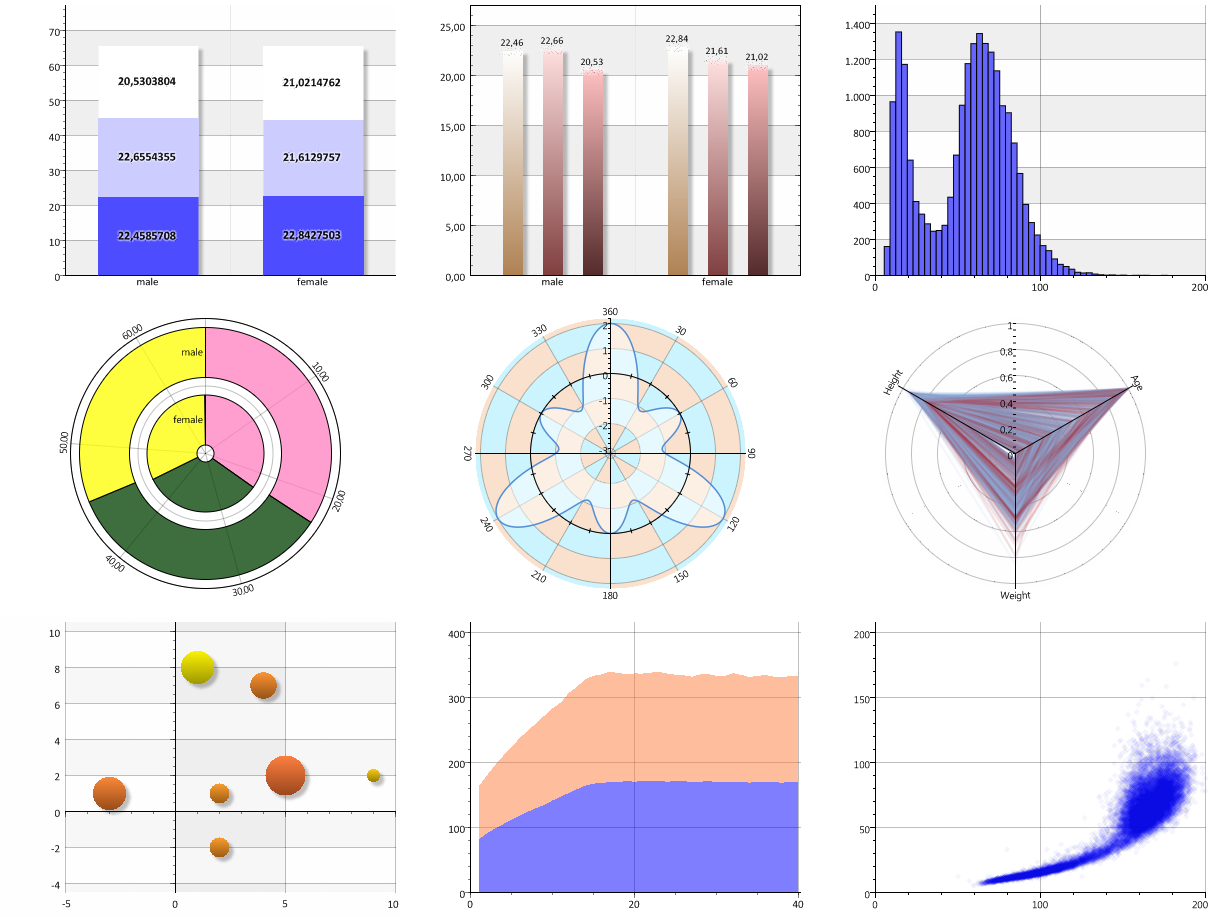


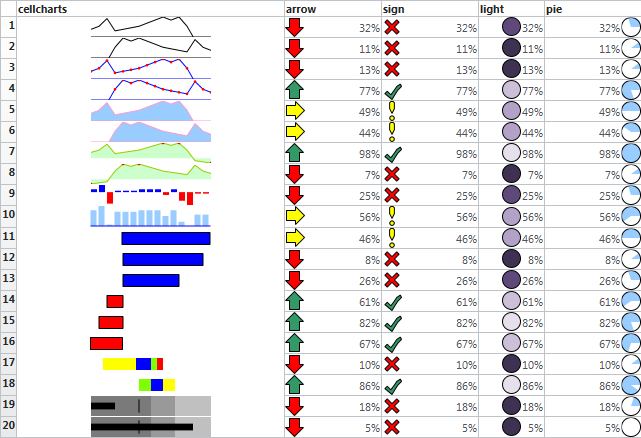
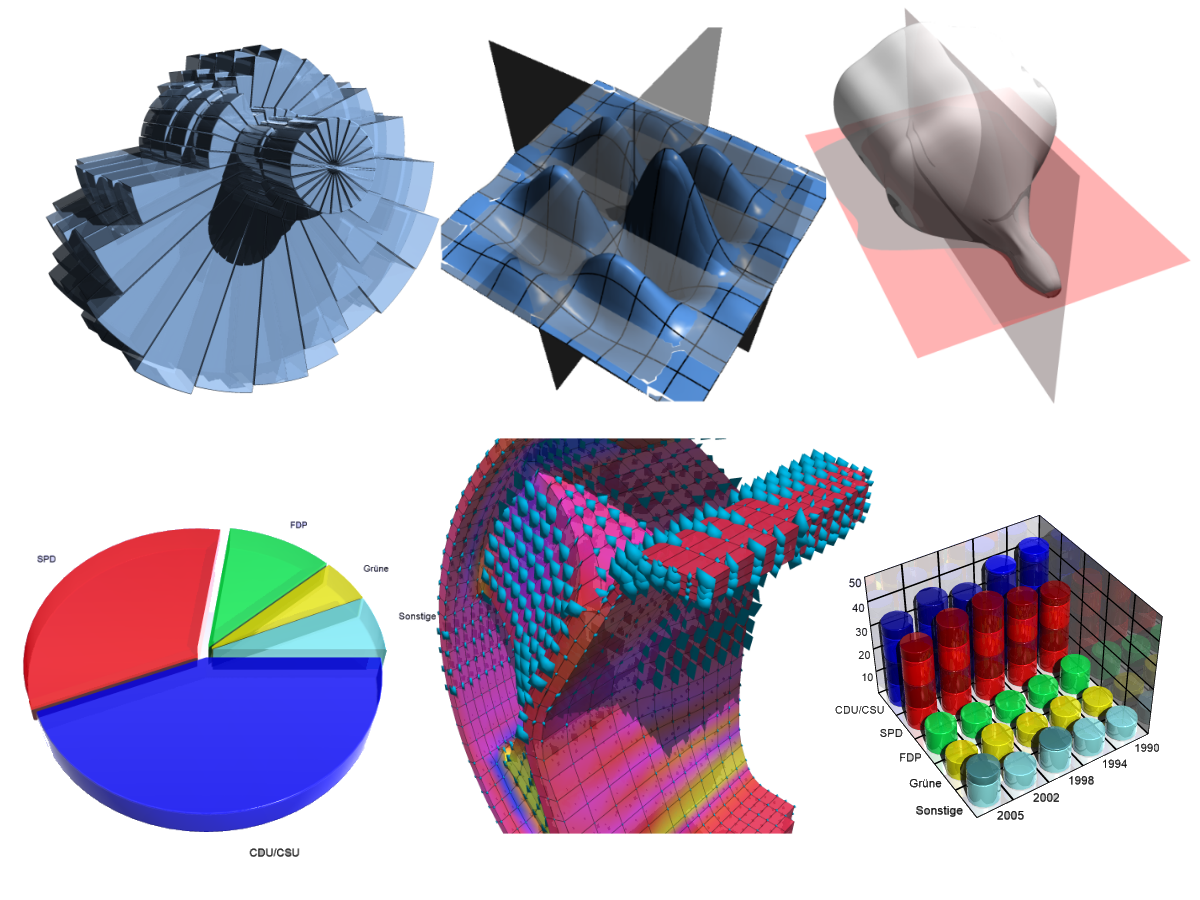
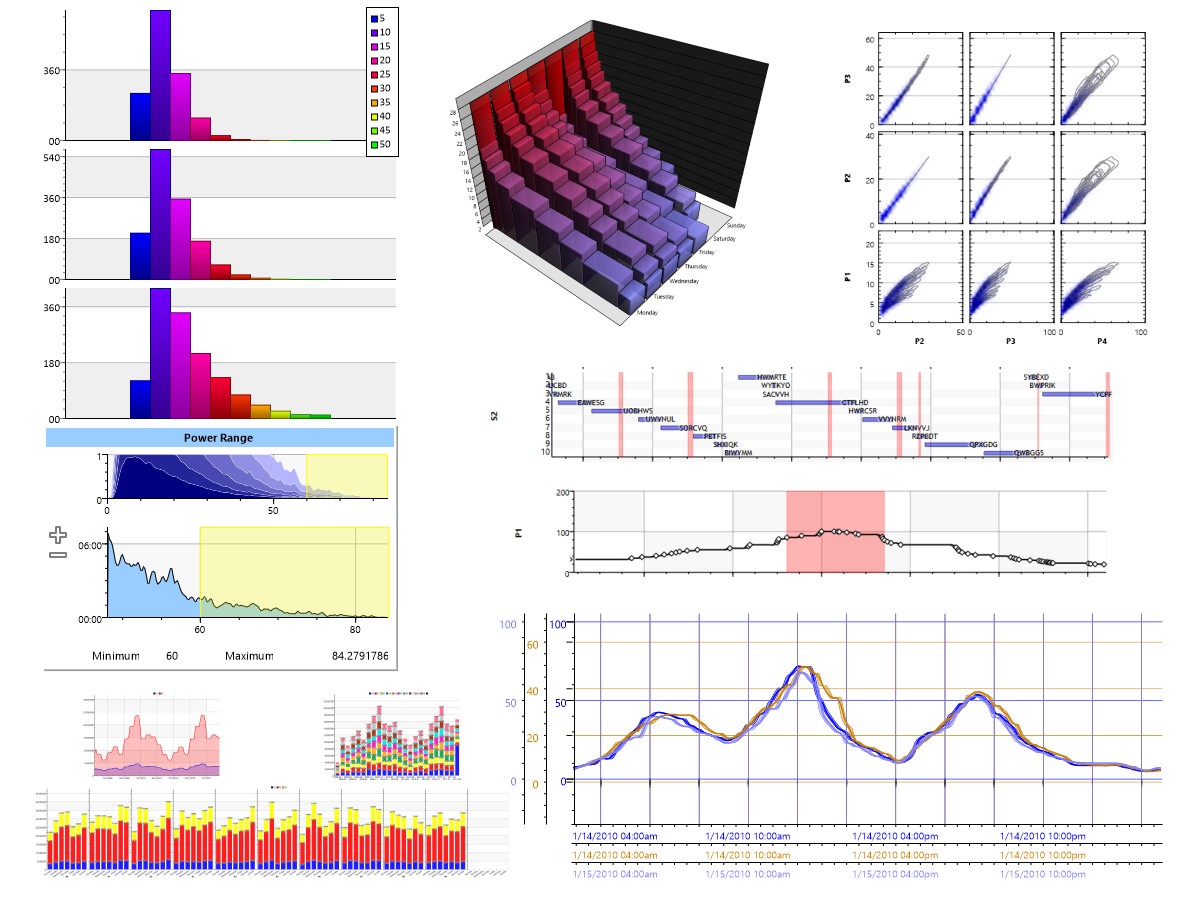
Present your data with the impressive built-in charts. Various charts types, sparklines or 3D diagrams form a basis for expressive data visualizations. Special requirements can be realized with the Chart Construction Kit.
Without limits visualizations in ANKHOR FlowSheet reach the third dimension, with 3D vector presentations and optional ray tracing. In addition visualizations of geographical data based on the OpenStreetMap project are supported besides further technical and scientific visualizations.
Interactive Dashboards
Quickly and simply generate interactive Dashboards. Aside from your data - regardless whether as a table, chart, visualization etc. - you can use input elements for manually entering data as well as elements for designing your own user interface. In addition, graphical user interfaces from the wizard operators can be integrated, too.
And without requiring an additional adaptation, interactive Dashboards from an ANKHOR server can step into action immediately on a browser. Check it out:

Deployment

Applications
Use ANKHOR FlowSheet to create applications for execution in the Dashboard of the FlowSheet Data Workbench, or for the command line client for batch processing or for one of our server products.

Reports and Documents
You can export the output of the FlowSheet Dashboard for your reports, but also create structured documents ready for printing. Your reporting becomes a special experience with the interactive Dashboards.

Data Services
The data processing of ANKHOR FlowSheet can be integrated with other programs written in C++ or C# via a DLL or be used simply as a web service with an ANKHOR server.

Ad-hoc analysis
Model data analyses simply and quickly with the intelligent operators in ANKHOR FlowSheet and gain deeper insight into your data quickly.
Platform Basics
![]() In-Memory Processing
In-Memory Processing
ANKHOR FlowSheet is already optimized in its foundations for processing large amounts of data in main memory. For this it employs not only an efficient data compression but also optimizes the structure of the data and incorporates it into the data management.
![]() Programming Language
Programming Language
A Data Workbench must be flexible and extendable. For this, programming is essential. ANKHOR FlowSheet uses its own programming language, which integrates into the visual paradigm and makes additional script programming redundant.
![]() Parallel Execution
Parallel Execution
The data flow graphs used by ANKHOR FlowSheet are optimal for parallelization of data processing and allow for parallel execution on several processor cores without the user having to consider this while constructing the graphs.